The numbers of regular season wins for 10 football teams in a given season are given below. Determine the range, mean, variance, and standard deviation of the population data set.2, 10, 15, 4. 14. 7. 14, 8, 2, 10The range is(Simplify your answer.)The population mean is(Simplify your answer. Round to the nearest tenth as needed.)The population variance is I(Simplify your answer. Round to the nearest tenth as needed.)The population standard deviation is(Simplify your answer. Round to the nearest tenth as needed)Enter your answer in each of the answer boxes.
Answers
The numbers of regular-season wins for 10 football teams in a given season are given below
\(2,10,15,4,14,7,14,8,2,10\)We are asked to find the range, mean, variance, and standard deviation of the population data set.
Range:
The range is the difference between the maximum value and the minimum value in a data set.
From the given data set,
Maximum value = 15
Minimum value = 2
\(\begin{gathered} \text{Range}=\text{maximum}-\text{minimum} \\ \text{Range}=15-2 \\ \text{Range}=13 \end{gathered}\)Therefore, the range is 13
Mean:
The population mean is given by
\(\mu=\frac{\sum^{}_{}X}{N}\)Where X is the terms in the data set and N is the number of terms in the data set.
\(\begin{gathered} \mu=\frac{2+10+15+4+14+7+14+8+2+10}{10} \\ \mu=\frac{86}{10} \\ \mu=8.6 \end{gathered}\)Therefore, the population mean is 8.6
Variance:
The population variance is given by
\(\sigma^2=\frac{\sum^{}_{}(X-\mu)^2}{N}\)Where X is the terms in the data set, μ is the mean, and N is the number of terms in the data set.
\(\begin{gathered} \sigma^2=\frac{\sum^{}_{}(X-\mu)^2}{N} \\ \sigma^2=\frac{(2-8.6)^2+(10-8.6)^2+(15-8.6)^2+(4-8.6)^2+(14-8.6)^2+(7-8.6)^2+(14-8.6)^2+(8-8.6)^2++(2-8.6)^2++(10-8.6)^2}{10} \\ \sigma^2=\frac{214.4}{10} \\ \sigma^2=21.4 \end{gathered}\)Therefore, the population variance is 21.4
Standard deviation:
The population standard deviation is given by
\(\begin{gathered} \sigma^{}=\sqrt[]{\frac{\sum^{}_{}(X-\mu)^2}{N}} \\ \sigma=\sqrt[]{\sigma^2} \end{gathered}\)Since we have already find the population variance, we can simply find take the square root of variance.
\(\begin{gathered} \sigma=\sqrt[]{\sigma^2} \\ \sigma=\sqrt[]{21.4} \\ \sigma=4.6 \end{gathered}\)Therefore, the population standard deviation is 4.6
Related Questions
Students (ages 10–18) were surveyed to choose a favorite free-time activity.
Playing Sports Watching Movies/TV Total
Middle School 16 21
High School 11
Total 19
Which category has the greatest marginal frequency?
High school students who chose playing sports
Middle school students who chose watching movie/TV
Students who chose playing sports
Students that are in middle school
Answers
Answer:
students that are in middle school
Step-by-step explanation:
i took the test and got it correct.
The category with the greatest marginal frequency is students who chose playing sports. The correct option is C.
What's the frequency?There are 16 students who chose playing sports in middle school and 11 students who chose playing sports in high school, for a total of 27 students who chose playing sports. This is the greatest marginal frequency of all the categories.
The marginal frequency for high school students who chose playing sports is 11.
The marginal frequency for middle school students who chose watching movies/TV is 21.
The marginal frequency for students who chose playing sports is 27.
The marginal frequency for students that are in middle school is 21.
Therefore, the answer is (C) Students who chose playing sports.
Learn more about marginal frequency
https://brainly.com/question/32433854
#SPJ2
SUSTAINIBILTY COUNTS! ENERGY CHALLENGE WHAT TO DO: COMPARITIVE STUDY OF CONSECUTIVE ELECTRIC BILLS o of post summer break with all calculations.
SUSTAINIBILTY COUNTS! ENERGY CHALLENGE
WHAT TO DO: COMPARITIVE STUDY OF CONSECUTIVE ELECTRIC BILLS HOW TO DO: 1) Examine your electricity bills of pre summer break.
2) List the various electrical appliances used in your home.
3) Find out the power consumption, duration for the device in use.
Do estimate calculation of your bills as per power consumption.
4) Make an energy reduction plan and determine how far you could implement it.
5) Re – examine your electricity bill of post summer break with all calculations.
6) WRITE your reduction plan & change in the bill.
Answers
Given statement solution is :-
1) Gather your electricity bills from the period before the summer break.
2) Create a comprehensive list of all the electrical appliances used in your home.
Include major appliances like air conditioners, refrigerators, washing machines, and smaller devices like televisions, computers, and lights.
3) Research or locate the power consumption information for each appliance.
4) Identify areas where energy consumption can be reduced, such as:
Turning off lights when not in use.
Setting air conditioner temperatures at an optimal level.
Using energy-efficient appliances.
5) After the summer break, collect your electricity bill for the corresponding period.
6) Include details about your energy reduction plan, the changes implemented, and the resulting impact on energy consumption and cost.
Provide recommendations for further improvements or adjustments to achieve even greater sustainability.
To conduct a comparative study of consecutive electric bills and analyze the impact of a reduction plan, you can follow the steps below:
Examine your electricity bills of pre-summer break:
Gather your electricity bills from the period before the summer break.
Look for details such as total energy consumption (in kilowatt-hours or kWh), billing period, and the cost per unit of electricity.
List the various electrical appliances used in your home:
Create a comprehensive list of all the electrical appliances used in your home.
Include major appliances like air conditioners, refrigerators, washing machines, and smaller devices like televisions, computers, and lights.
Find out the power consumption and duration for each device in use:
Research or locate the power consumption information for each appliance.
This information is typically provided on the appliance itself or in the user manual.
Note down the power rating of each device in watts (W) or kilowatts (kW).
Estimate the average duration each device is used daily in hours (e.g., 2 hours for a television, 8 hours for a refrigerator).
Calculate the estimated electricity consumption and cost:
Multiply the power rating (in kW) of each device by its average daily usage (in hours) to find the daily energy consumption (in kWh).
Multiply the daily energy consumption by the number of days in the billing period to get the total energy consumption for that period.
Multiply the total energy consumption by the cost per unit of electricity to calculate the estimated cost for each appliance.
Sum up the estimated costs for all appliances to get the total estimated electricity bill.
Make an energy reduction plan and determine implementation:
Identify areas where energy consumption can be reduced, such as:
Turning off lights when not in use.
Setting air conditioner temperatures at an optimal level.
Using energy-efficient appliances.
Unplugging devices when not in use.
Determine the feasibility of implementing these energy reduction measures in your home.
Re-examine your electricity bill of post-summer break:
After the summer break, collect your electricity bill for the corresponding period.
Calculate the actual energy consumption and cost using the same method as in step 4.
Compare the actual post-summer break bill with the estimated pre-summer break bill.
Note any changes in energy consumption and cost, and analyze the effectiveness of your energy reduction plan.
Document your reduction plan and changes in the bill:
Write a report summarizing your findings and observations.
Include details about your energy reduction plan, the changes implemented, and the resulting impact on energy consumption and cost.
Provide recommendations for further improvements or adjustments to achieve even greater sustainability.
By following these steps, you can conduct a comparative study of consecutive electric bills, analyze the effectiveness of your energy reduction plan, and track changes in energy consumption and costs.
For such more questions on Sustainable Energy Bill Study
https://brainly.com/question/3159537
#SPJ8
On a coordinate plane, an exponential function that has a horizontal asymptote of y = 0 is shown. The function has points (negative 2, StartFraction 4 Over 81 EndFraction), (negative 1, two-ninths), (0, 1), (1, nine-halves), (2, StartFraction 81 Over 4 EndFraction)
What is the multiplicative rate of change of the exponential function shown on the graph?
Answers
Answer:
9/2
Step-by-step explanation:
It is the ratio between y-values for consecutive x-values. Perhaps the easiest two points to work with are ...
(x, y) = (0, 1), (1, 9/2)
The rate of change you're looking for is (9/2)/1 = 9/2.
Answer:
D. 9/2
Step-by-step explanation:
Edge 2021
the area of this figure is? sq meters
Answers
Answer:
The figure was not included in your question?
Select ALL of the solutions of the following system of linear inequalities below.

Answers
The solutions of the system of inequalities are:
(0, 3)
(6, 2)
How to find the solutions of the system?Here we have the graph of a system of inequalities, the solutions are all the points on the area where the two shaded regions intercept (it would be on the purple area).
And we can see that one line is solid, the points on that line are solutions, the other line is dashed, the points on that line are not solutions.
Then the points that are solutions are:
(0, 3)
(6, 2)
Learn more about systems of inequalities:
https://brainly.com/question/9774970
#SPJ1
No
0.7
What’s the percentage
Answers
Answer: 70%
Step-by-step explanation:
0.7
----- x 100% = 70%
1
Answer:
70%
Step-by-step explanation:
When turning a decimal into a percent always bring the decimal point two places to the right.
0.7.0.
070%
70%
Find the maximum and minimum points of the function y = –2 cos (x + π/2) + 1.

Answers
The maximum and minimum points of the function are (a) (3π/2, -1) (-π/2, -1), (π/2, 3)
How to determine the maximum and minimum points of the function?From the question, we have the following function that can be used in our computation:
y = –2 cos (x + π/2) + 1.
Calculating the maximum
Here, we have
y = –2 cos (x + π/2) + 1.
Next, we plot the graph of the function
From the graph of the function, we have the maximum points to be (π/2, 3)
Calculating the minimum
Here, we have
y = –2 cos (x + π/2) + 1.
Next, we plot the graph of the function
From the graph of the function, we have the minimum points to be
(3π/2, -1) (-π/2, -1)
Read more about trigonometry functions at
https://brainly.com/question/24349828
#SPJ1

Anu is a photographer and was recently hired to photograph a wedding in Hawaii. While there, Anu had some time to
explore the island and capture other beautiful pictures.
During the trip, Anu took a total of 1,200 photographs. Of these, 25% were wedding photos, 35% were pictures of Lanikai
Beach, and the rest of the pictures were taken at the Honolulu Zoo. How many of Anu's pictures were taken at the Honolulu
Zoo?
Answers
ANSWER: 480 out of 1200 were taken at the Honolulu Zoo.
Describe as precisely thoroughly as possible why critical values of a function f(x) occur either where f′(x) = 0 or where f′(x) is undefined.
Answers
Well, most books define critical values of a function as x-values where f'(x)=0 or f'(x) is undefined, so they occur there because that's the definition of what a critical value is.
But the reason we define it that way is that when you're looking for local extrema (local mins and/or local maxs), these must occur when f'(x)=0 or f'(x) is undefined.
If f has a local extremum at a point x=c, then f'(c)=0 or f'(c) is undefined.
describe this diagram help please

Answers
Answer:
U are finding the slope. so the vertical line is ur rise(x value) and the horizontal line is ur y value. Hopefully that helped
In the real world, functions are mathematical representations of input-output situations. A vending machine is one such example. The input is the money combined with the selected button. The output is the product.
Here is another example: The formula for converting a temperature from Fahrenheit to Celsius is a function expressed as:
C = (5/9)*(F - 32), where F is the Fahrenheit temperature and C is the Celsius temperature.
If it is 77 degrees Fahrenheit in Phoenix Arizona, then what is the equivalent temperature on the Celsius thermometer?
Our input is 77.
C = (5/9)*(77 - 32)
C = (5/9)*(45)
C = 25
The equivalent temperature is 25 degrees Celsius.
To complete the Discussion activity, please do the following:
Choose your own function or choose from the list below and then provide a unique example of a function and evaluate the function for a specific input (like the example above).
Arm length is a function of height.
The circumference of a circle is a function of diameter.
The height of a tree is a function of its age.
The length of person's shadow on the ground is a function of his or her height.
Weekly salary is a function of the hourly pay rate and the number of hours worked.
Compound interest is a function of initial investment, interest rate, and time.
Supply and demand: As price goes up, demand goes down.
Answers
The correct answer is John's weekly salary is $240 based on his hourly pay rate and the number of hours worked.
Let's choose the function "Weekly salary is a function of the hourly pay rate and the number of hours worked."Example: John works as a part-time employee at a grocery store. His hourly pay rate is $12, and he worked for 20 hours in a week. We can evaluate the function to find his weekly salary.
Weekly salary = Hourly pay rate * Number of hours worked
Weekly salary = $12/hour * 20 hours
Weekly salary = $240
So, John's weekly salary is $240 based on his hourly pay rate and the number of hours worked.
Learn more about temperature here:
https://brainly.com/question/25677592
#SPJ8
Round 18.123 to the nearest hundredth
Answers
18.100
If you ask '' How do I solve these questions?'' I say:
We look at the tens digit to find the nearest hundred. If the number is 1,2,3 or 4, the tens and ones digit is reset. If it is 5,6,7,8 or 9, another hundred is added to the hundreds place of the number. The remaining tens and hundreds digits are reset.
3. Mr. Keen buys a wagon that was originally priced at $130 and then
reduced by 10%. What was the reduced price?
Answers
Answer:
it would be reduced to $117. dollars
Step-by-step explanation:
=)
find the mean and median of each of the following sets of data. determine the deviation from the mean for each data point within the sets and find the mean deviation for each set. 24.49 24.68 24.77 24.83 24.73
Answers
The average distance from the mean is 0.09.
The mean is also known as the average and is calculated by adding up all the values in the set and then dividing the sum by the total number of values.
So, for the given set of data: 24.49, 24.68, 24.77, 24.83, 24.73, the mean would be calculated as follows:
Mean = (24.49 + 24.68 + 24.77 + 24.83 + 24.73) / 5
= 24.70
It tells us what the typical value is within the data set. In this case, the mean value of the data set is 24.70.
Next, let's find the median of the set of data. The median is the middle value of a data set when it is arranged in numerical order. In this case, the data set is already arranged in numerical order, so we can easily find the median.
The median value of the data set is the middle value, which is 24.77.
Now, we will calculate the deviation from the mean for each data point within the set. The deviation from the mean tells us how far each value is from the mean value. This is calculated by subtracting the mean from each value in the set.
Deviation from the mean for each data point:
-0.21, -0.02, 0.07, 0.13, 0.03
As you can see, some values are above the mean, and some are below the mean. The deviation from the mean can be used to determine how spread out the data is from the mean value.
Finally, we will calculate the mean deviation for the set. The mean deviation is the average of the absolute values of the deviation from the mean.
Mean deviation = (|(-0.21)| + |(-0.02)| + |0.07| + |0.13| + |0.03|) / 5
= 0.09
The mean deviation tells us the average distance from the mean value.
To know more about mean here.
https://brainly.com/question/22871228
#SPJ4
General form of
Y= 1/3x +3 and has an x intercept of 3
Answers
Answer:
Step-by-step explanation:
y
=
1
3
x
−
3
Use the slope-intercept form to find the slope and y-intercept
Slope:
1
3
y-intercept:
(
0
,
−
3
)
Any line can be graphed using two points. Select two
x
values, and plug them into the equation to find the corresponding
y
values.
x
y
0
−
3
3
−
2
Graph the line using the slope and the y-intercept, or the points.
Slope:
1
3
y-intercept:
(
0
,
−
3
)
x
y
0
−
3
3
−
2
image of graph

Problem 3-66
Examine each diagram below. Which diagrams are possible? Which are impossible? Justify each conclusion
Hint:
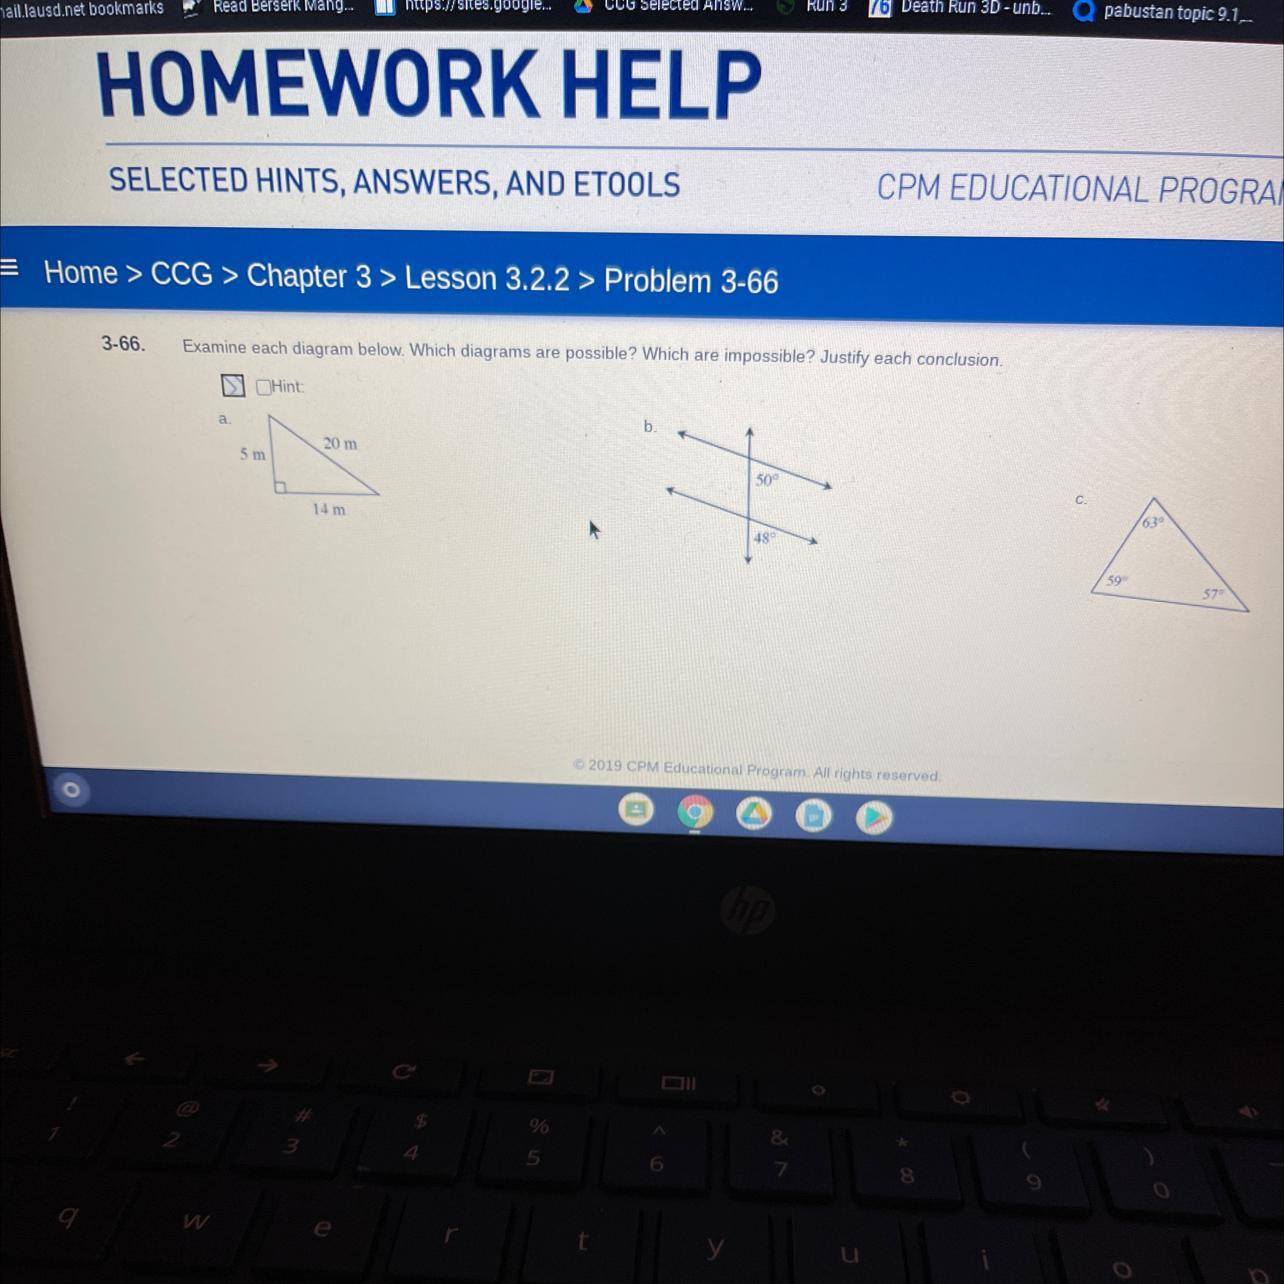
Answers
Answer:
All of them is impossible in mathematics
Step-by-step explanation:
In the first diagram we see a right triangle, which we can use pythagorean theorem to verify , but 20^2-14^2 does not equal to 5^2
IN the second diagram, According to the corresponding angles theorem, the statement “If a line intersects two parallel lines, then the corresponding angles in the two intersection regions are congruent” is true either way. But in the diagram we see 50 isn't equal to 48, hence it's a false statement too.
In the third diagram, we see we can verify it using the summation of triangle a+b+c=180, we clearly see 63+59+57 isn't equal to 180
So, indeed, all of the three diagram is impossible to exist in mathematics
Consider the proposition
2x + 5 > 13
(a) is the condition x > 0 necessary, or sufficient, or both necessary and sufficient for the
inequality to be satisfied?
(b) Answer the same question when x 0x is replaced by x 50
(c) Answer the same question when x > 0 is replaced by x > 4.
Answers
your answer is C
your answer is C
your answer is C
your answer is C
your answer is C
Answer:
C
Step-by-step explanation:
2x+5=13
2x+5-5=13-5
2x=8
2x/2=8/2
X=4
7.) According to the quantity equation, changes in the money supply will lead directly to
changes in the price level if velocity and real GDP are unaffected by the change in the
money supply. Will velocity change over time? What factors might lead to changes in
velocity? Are those changes related to changes in the money supply?
Answers
According to the quantity theory of money, changes in the money supply will lead directly to changes in the price level if velocity and real GDP are unaffected by the change in the money supply.Velocity can change over time, and changes in velocity may be caused by various factors.
For example, changes in velocity can be caused by shifts in payment practices, changes in the use of credit, changes in the availability of bank deposits or cash, or shifts in demand patterns.Changes in velocity may be related to changes in the money supply.
For example, if the money supply increases, the demand for money may increase, causing the velocity of money to decrease. Conversely, if the money supply decreases, the demand for money may decrease, causing the velocity of money to increase.
For more question on velocity
https://brainly.com/question/25749514
#SPJ8
unit rate for $128 for food for 16 dogs please its friday i need this
Answers
Answer:
Step-by-step explanation:
Unit rate = 128 ÷ 16 = 8$
Answer:
$8 if it's wrong i'm sorry.
can someone help me out please asap

Answers
Answer:
a is your answer
(A) 7 (Square root) X^4
Step-by-step explanation:
The form that the expression is in is exponentiation, and needs to be rewritten in radical form. To do this, you must use the rule of
x
m
n
=
n
√
x
m
A person from Switzerland consumes about 9.1 kilograms of chocolate per
year. A person from the United States consumes about 4.7 kilograms of
chocolate per year. How many times as much chocolate will a Swiss
person consume in one year than someone from the United States? Round
your final answer to the nearest tenths
Answers
Answer:
switzerland was the leading country in chocolate consumption per capita in 2017, with citizens eating nearly nine kilos of the sweet stuff in that year. World renowned for the chocolate they produce, it seems the Swiss themselves can’t get enough of the candy. Germany, the country’s neighbor, is equally addicted, importing the largest share of Swiss chocolate of all countries in the world.
Step-by-step explanation:
Answer: a swede would consume 1.9 times as much chocolate as an American.
Step-by-step explanation: 9.1 / 4.7 = 1.93617021. round to the nearest tenth = 1.9.
1.93617021 times 4.7 equals 9.1
Gideon took out an R150 000 loan this morning, to buy a house. The interest rate on a mortgage is 7,35%. The loan is to be repaid in equal monthly payments over 20 years. The first payment is due one month from today. How much of the second payment applies to the principal balance? (Assume that each month is equal to 1/12 of a year.)
Answers
Answer:
Step-by-step explanation:
To solve this problem, we can use the formula for calculating the fixed monthly payment on a mortgage:
P = (r * PV) / (1 - (1 + r)^(-n))
where:
P = fixed monthly payment
r = monthly interest rate (annual interest rate divided by 12)
PV = present value of the loan (loan amount)
n = total number of payments (number of years multiplied by 12)
Using the given values:
r = 0.0735 / 12 = 0.006125
PV = R150,000
n = 20 x 12 = 240
Then we can calculate the monthly payment:
P = (0.006125 * 150000) / (1 - (1 + 0.006125)^(-240)) = R1,181.91
This means that Gideon will have to pay R1,181.91 every month for 20 years to repay his loan.
To determine how much of the second payment applies to the principal balance, we need to calculate the interest and principal amounts of the first payment.
For the first payment, the interest can be calculated as:
interest1 = r * PV = 0.006125 * 150000 = R918.75
This means that the first payment consists of R918.75 in interest and the rest, R1,181.91 - R918.75 = R263.16 is principal.
To find out how much of the second payment applies to the principal balance, we need to subtract the interest and add the calculated principal amount from the first payment to the amount of the second payment:
principal2 = (P - interest1) + principal1 = (1181.91 - 918.75) + 263.16 = R525.32
Therefore, R525.32 of the second payment applies to the principal balance.
Phil has some $2 bills and some $5 bills worth a total value of $81. If he replaced the $2 bills with the same number of $5 bills and the $5 bills with the same number of $10, he would have $175. How many $2 bills does he have?
Answers
Answer:
Step-by-step explanation:
js 5
Answer:
Let x be the number of $2 bills Phil has. Then he has (81-2x)/5 $5 bills. If he replaced the $2 bills with the same number of $5 bills and the $5 bills with the same number of $10, he would have (81-2x)/5 $10 bills and x $5 bills. This gives us an equation:
(81-2x)/5 * 10 + x * 5 = 175
Simplifying this equation gives us:
16x = 725
Therefore, x = 45.3125
Since Phil cannot have a fractional number of $2 bills, we round down to get that Phil has 45 $2 bills
Step-by-step explanation:
PLEASE HELP ME WITH THIS!!!

Answers
Answer:
a) 70°
Step-by-step explanation:
∠3 = 110
∠5 = ∠1
∠1 = 180 - ∠3
∠1 = 180 - 110
∠ 1 = 70
∠5 = ∠1 (corresponding angles postulate)
∠5 = 70
The diagram shows a square.
(6x - 1) cm
Find the length of the side of the square.
Your final answer must say, side = . . . cm
(4x + 6) cm
Cm=?
+
Answers
The length of the side of the square is given as follows:
20 cm.
How to obtain the side length of the square?In the figure, there are two expressions used to give the side length to each square, as follows:
6x - 1.4x + 6.In a square, all the four side lengths have the same length, hence the value of x is obtained as follows:
6x - 1 = 4x + 6
2x = 7
x = 3.5 cm.
Then the side length of the square is obtained as follows:
6(3.5) - 1 = 20 cm.
More can be learned about the side length of a square at https://brainly.com/question/24487155
#SPJ1
50 POINTS !!! Which are like terms in this expression?
−13n − 13 + 3/4n −1 3/4
A. − 13n and −13
B. − 13n and + 3/4n
C. − 13 and 3/4n
D. + 3/4n and − 1 3/4
Answers
Answer:B
Step-by-step explanation: They both have a variable.
Reason: Both involve the variable n.
Something like choice A is eliminated since -13n has n, but -13 does not. Choices C and D are eliminated for similar reasoning.
What is the area of a square with sides 12 m?
Answers
Answer:
144m²
Step-by-step explanation:
area is equal to side×side
side=12
=12×12
=144m²
Answer:
\(144m^{2}\)
Step-by-step explanation:
Square = length * width
As everyone knows that the length and width of a square are the same, 12 times 12 equals 144.
The graph of a function shown below. Use the graph of the function to find its average rate of change from x=to x = 4; x = 8

Answers
Recall that the average rate of change between a and b is given by the following formula:
\(\frac{f(a)-f(b)}{a-b}\text{.}\)From the graph we get:
\(\begin{gathered} f(4)=-1, \\ f(8)=-9. \end{gathered}\)Therefore, the average rate of change from x=4 to x=8 is:
\(\frac{f(4)-f(8)}{4-8}=\frac{-1-(-9_{})}{-4}=\frac{-1+9}{-4}=\frac{8}{-4}=-2.\)Answer: -2.
I need Help please!!!

Answers
Step-by-step explanation:
it seems you solved the tricky part yourself already.
just to be sure, let's do the first derivative here again.
the easiest way would be for me to simply multiply the functional expression out and then do a simple derivative action ...
f(t) = (t² + 6t + 7)(3t² + 3) = 3t⁴ + 3t² + 18t³ + 18t + 21t² + 21 =
= 3t⁴ + 18t³ + 24t² + 18t + 21
f'(t) = 12t³ + 54t² + 48t + 18
and now comes the simple part (what was your problem here, don't you know how functions work ? then you are in a completely wrong class doing derivatives; for that you need to understand what functions are, and how they work). we calculate the function result of f'(2).
we simply put the input number (2) at every place of the input variable (t).
so,
f'(2) = 12×2³ + 54×2² + 48×2 + 18 = 96 + 216 + 96 + 18 =
= 426
NO LINKS!!
Please help with these proofs Part 2

Answers
Given:
CF bisects BD,∠1 ≅ ∠2To prove CD ≅ BF, we'll first prove the triangles are congruent by AAS as we have one congruent angle pair, there is another pair of vertical angles and congruent sides as part of bisected segment.
Statement Reason
CF bisects BD Given∠1 ≅ ∠2 GivenBE = ED Definition of bisector∠3 ≅ ∠4 Vertical angles are congruent ΔCED ≅ ΔFEB AAS congruence (adjacent angles and not included side)CD ≅ BF CPCTCProvedProblem 6Given:
TR bisects SA,ST ≅ TATo prove ∠S ≅ ∠A, we'll first prove the triangles are congruent by SSS as we have one congruent side pair, one more side is common to both triangles, another side pair is congruent as part of bisected segment.
Statement Reason
TR bisects SA GivenST ≅ TA GivenSR ≅ AR Definition of segment bisectorTR ≅ TR Reflexive property (common side)ΔSTR ≅ ΔATR SSS congruence∠S ≅ ∠A CPCTCProved